Science Seen Physicist and Time One author Colin Gillespie helps you understand your world.

Global Warming Losing Heat?
The message of Dr. Bernard Forscher’s brick allegory is that data can obstruct the search for scientific explanation. Today we check a story about missing heat (recent fodder for climate-change denial). On the way to explanation we’ll see data being tweaked to say more than they should. (Data in my book is plural and datum is its singular.) Science has two main activities: getting data (mostly numbers); and interpreting data (testing or devising theories). The relationship between them is especially significant for climate science.
For some time skeptics have been making much of recent global-temperature trends. They suggest that back in 1999 the warming stopped. They point to surface mean-temperature data―numbers often shown as graphs.
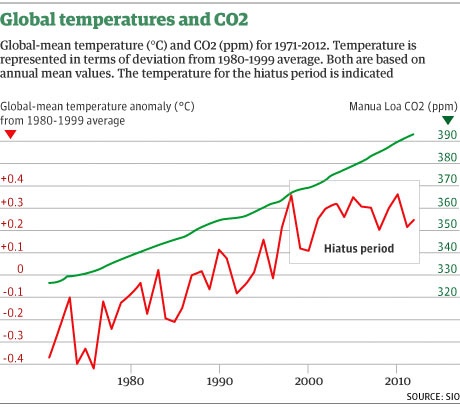 Here is an example. It is from The Guardian, who got it from the Scripps Oceanographic Institution. A fine pedigree you’d think. But keep a thoughtful eye on all displays of data and the tales they tell. Note that the red line (change in temperature, left scale) and green line (carbon dioxide level, right scale) are distinct graphs. Juxtaposing them creates choices of scale and relative position. In The Guardian’s image, the green line is scaled to parallel the red and positioned so it clips the 1998 spike of the red line. Can you mentally Photoshop the right scale two and a half steps down so the green line threads through the middle of the red 1970-1998 zigzag. You’ll see that much of the post-1998 ‘Hiatus period’ (framed for your eye by outlining it and by leaving out the gridlines―spin added by The Guardian) seems to disappear. That’s not to say there’s no hiatus. There is one, but it’s less dramatic than this image seems to show.
So, what’s the story: Did still-increasing CO2 stop trapping solar heat on January 1, 2000? If you think this seems unlikely I think you are right. But if solar heat is still arriving and remaining, yet the average global temperature stopped rising, what’s the explanation? Where’s the missing heat?
Tracking heat on Earth is not like slipping a thermometer beneath a tongue. The Earth’s air and land and ice and oceans form a heat machine so large and complex we often lack sufficient data. But an explanation is emerging from much careful work: Heat is hiding in the oceans.
Oceans are a good place to look because Earth’s oceans hold about ten times more heat than its atmosphere does. Last year Scripps scientists found heat hiding in the Pacific Ocean and suggested it’s related to a La Niña phase of water sloshing east-west in the Pacific basin. But it was not enough. Now Chinese climatologist Xianyao Chen and American mathematician and meteorologist Ka-Kit Tung seem to have found the ‘missing’ heat.
Chen and Tung analyzed 16 GB of temperature and salinity data for a 44-year period and found most of the ‘missing’ heat in deep (1 km) waters of the Atlantic and Southern Oceans. They suggest that vertical currents caused by surface salinity buried it. They too find some ‘missing’ heat in the Pacific and agree it is related to La Niña.
They say that the relief from rising temperatures will be temporary. When the heat sink switches off again, they warn, ‘as it inevitably will, another episode of accelerated global warming should ensue.’
So if someone tells you that the climate stopped changing you’ll know more of the story thanks to Chen and Tung.
Sources:
Rob Monroe (2013), “Solving the Mysteries of Hiatus in Global Warming”, The Keeling Curve, San Diego: Scripps Institution of Oceanography, August 28, https://scripps.ucsd.edu/programs/keelingcurve/2013/08/28/solving-the-mysteries-of-hiatus-in-global-warming/#more-925
Fiona Harvey (2013), “Cooling Pacific has dampened global warming, research shows”, The Guardian, London: Guardian News and Media, August 28, http://www.theguardian.com/environment/2013/aug/28/cooling-pacific-dampened-global-warming
Xianyao Chen & Ka-Kit Tung (2014), “Varying planetary heat sink led to global warming slowdown and acceleration”, Science, Washington: American Association for the Advancement of Science, vol. 345, p. 897; http://www.sciencemag.org/content/345/6199/897.full.pdf
Image credit: The Guardian
No comments yet.